#121
Itt meg egy másik előrejelzés.
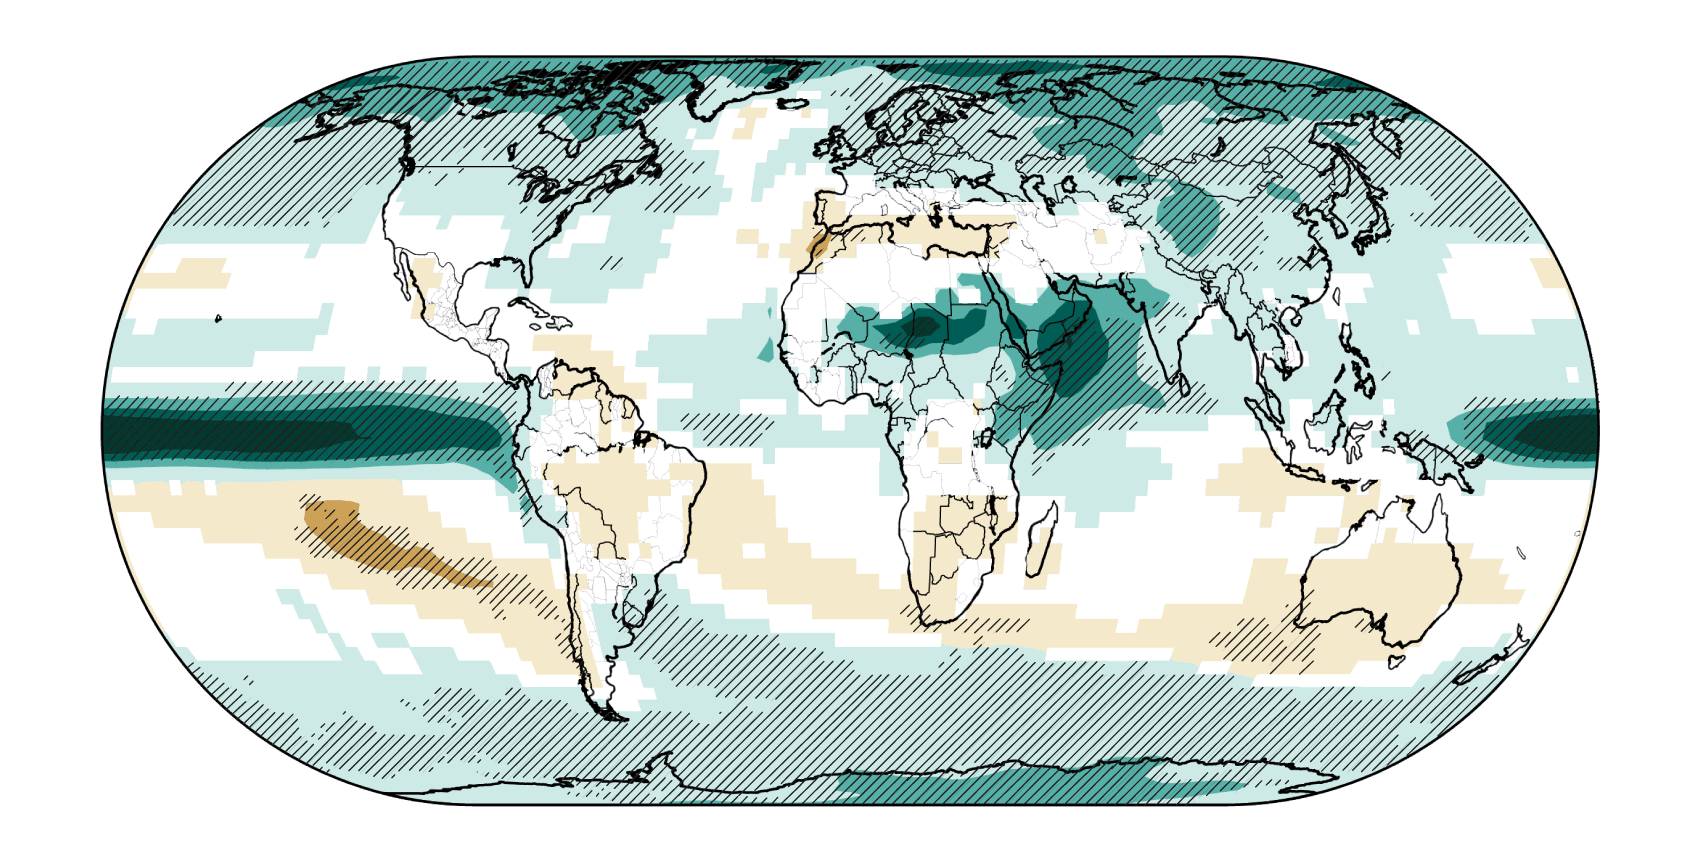
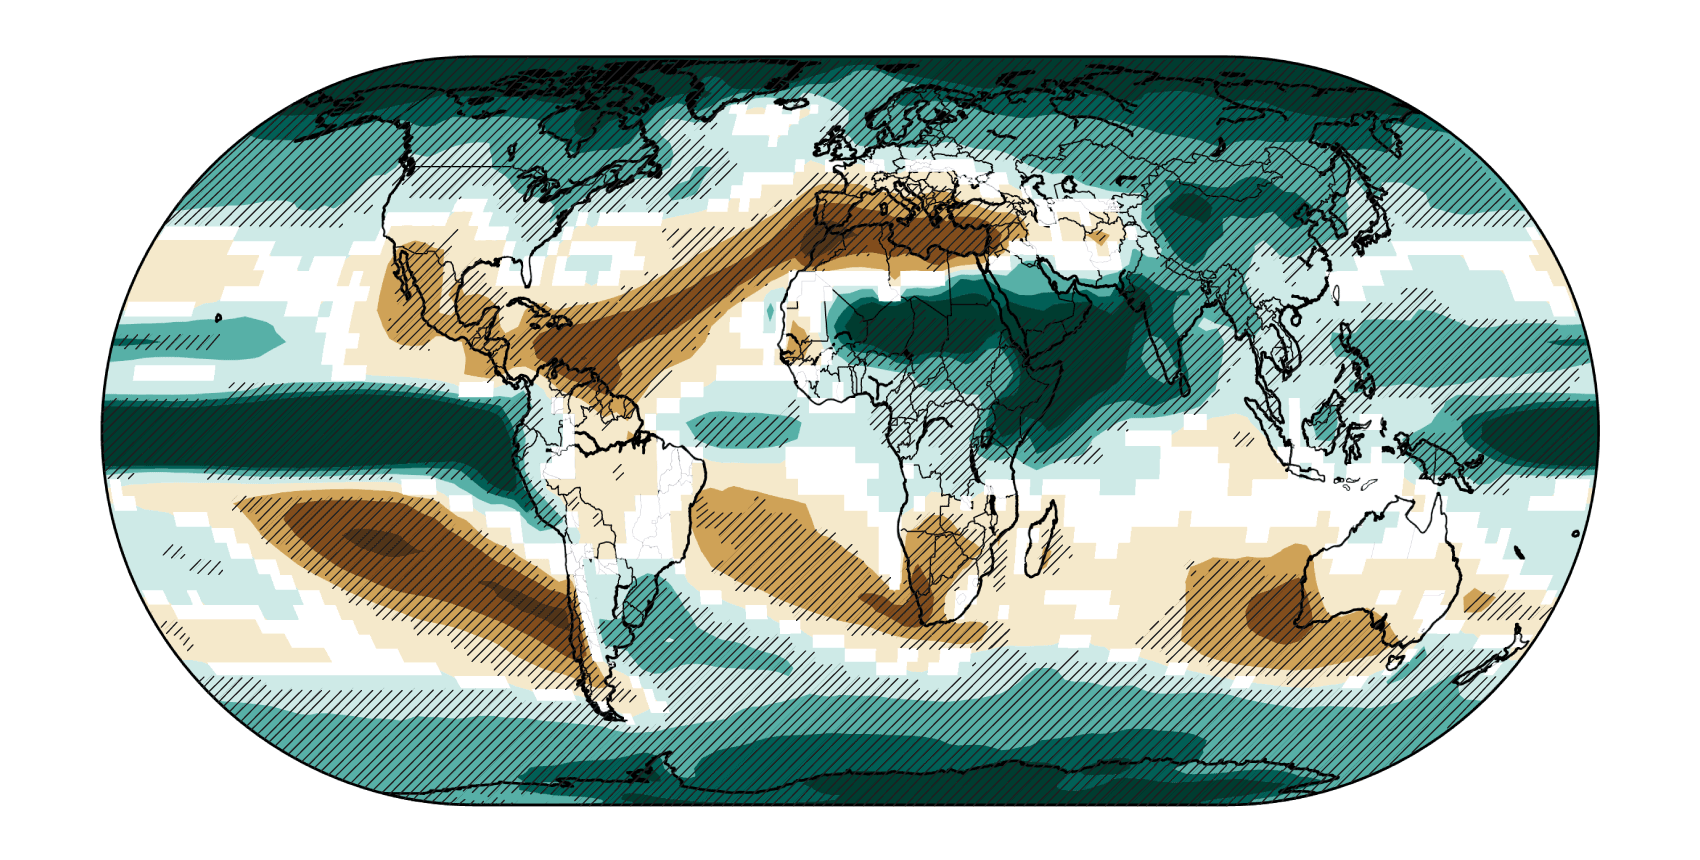
Figure 2.6: Projected change in average annual precipitation over the period 2071-2099 (compared to the period 1970-1999) under a low scenario that assumes rapid reductions in emissions and concentrations of heat-trapping gasses (RCP 2.6), and a higher scenario that assumes continued increases in emissions (RCP 8.5). Hatched areas indicate confidence that the projected changes are significant and consistent among models. White areas indicate that the changes are not projected to be larger than could be expected from natural variability. In general, northern parts of the U.S. (especially the Northeast and Alaska) are projected to receive more precipitation, while southern parts (especially the Southwest) are projected to receive less. (Figure source: NOAA NCDC / CICS-NC). Link
Nem tűnik túl kiforrottnak a sztori. Egyiptomban, Etiópiában akkor most mire készüljenek szárazságra, vagy heves esőzésekre!? Utoljára szerkesztette: NEXUS6, 2017.08.09. 00:13:41
 #121
#121